Hotest Day in Record
Jul 6, 2023
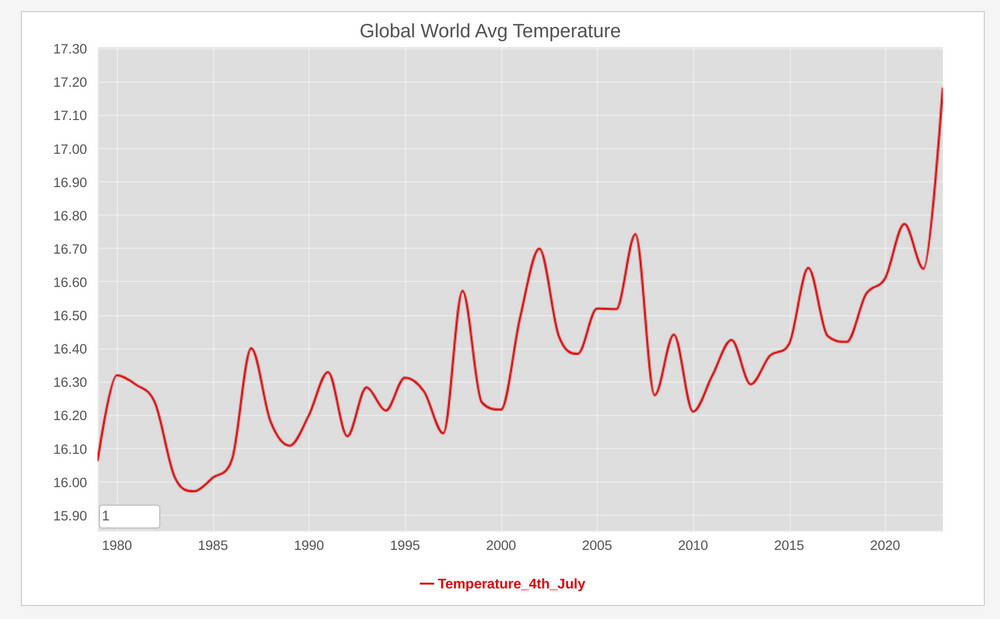 Meteorological organizations and climate research institutions maintain historical weather data and climate records, including temperature measurements from various locations. The Climate Change Institute at the univsersity of main is one of those institutions. And accordingly to the data collected since 1976, yesterday while the US was celebratiing their US independence day, that day turned out to be the hotest in record on that dataset.
Earth is warming significantly and rapidly
Jan 30, 2022
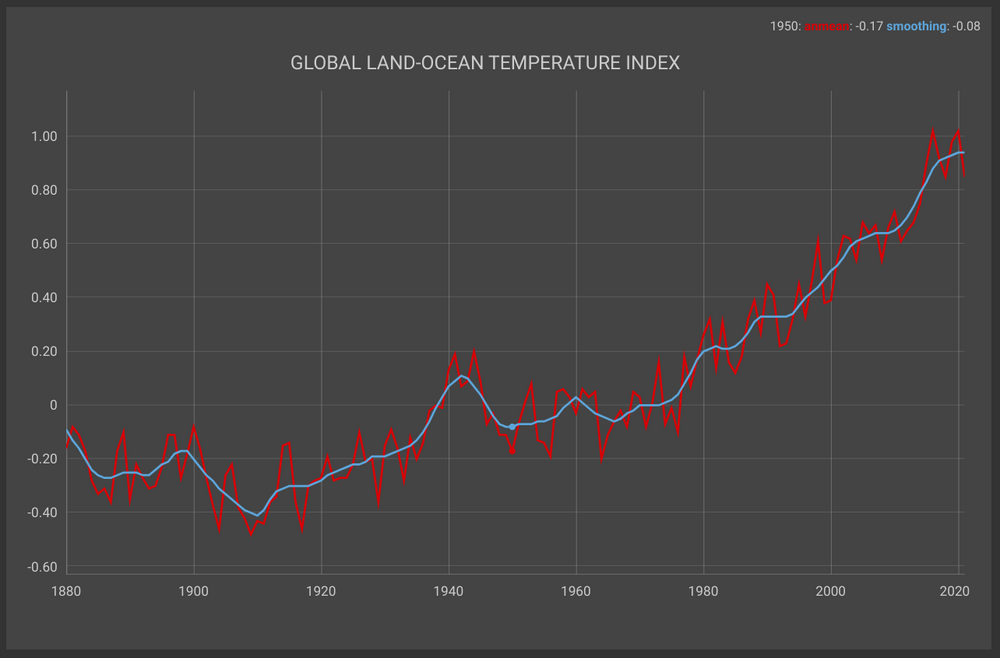
A couple of weeks ago, NASA issued a press release explaining that "Earth’s global average surface temperature in 2021 tied with 2018 as the sixth warmest on record, according to independent analyses done by NASA and the National Oceanic and Atmospheric Administration"
The NASA Administrator Bill Nelson was sounding the alarm in the same PR: "Eight of the top 10 warmest years on our planet occurred in the last decade ...". The news was barely cover by the mainstream media, echoing some of the points exposed in the recently brilliant movie "Don't look up" by Adam McKay.
Global Warming is real and the issue should be taken seriously by each goverment and each citizen of this planet earth.
US Northwest Melting
Jun 30, 2021
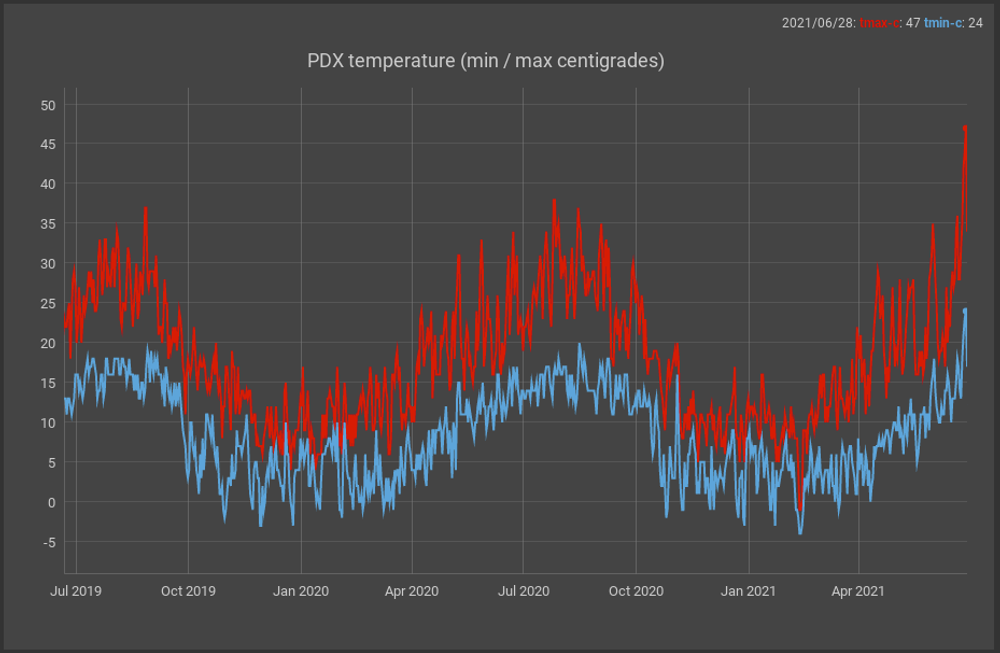
I have been reading the news for the last few days as the northwestern United States has experienced a strong heat wave that has broken all records in its major cities including Seattle and Portland.
There are even reports that it is mentioned that part of the infrastructure of those cities is literally melting due to that heat wave. The PDX airport maintains records of the highest and lowest temperatures every day since 1938 (see charts above) and when observing a graph of these data it is clear that the temperatures of the last days are surprising for that region of the country.
I have been saying it for a while in this blog: Global warming is not a joke!
100 seconds to midnight
Jan 27, 2020
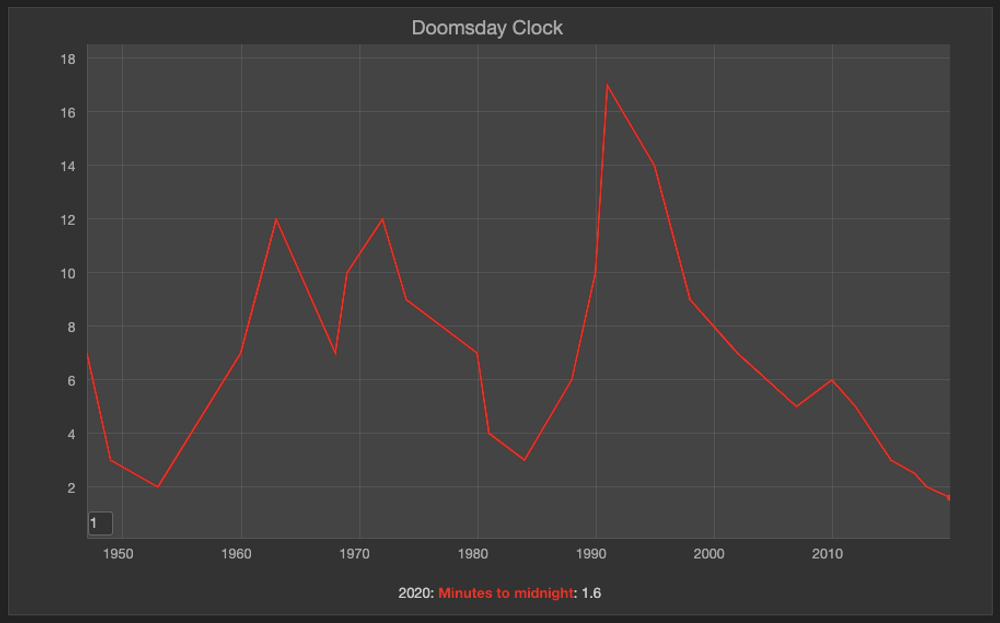
A couple of days ago I stumble into the headline ‘Doomsday Clock is now 100 seconds from midnight’, published by space.com. I wasn’t aware but this clock is a metaphor for close we are in the world to a man-made global catastrophe. This device was setup in 1947 by the members of the Bulletin of the Atomic Scientists, when nuclear weapons were considered the main threat. Today the global warming issue is also considered in the equation on how to calculate this time.
Unfortunately but not surpising this time around in 2020, it’s the closest it has been to midnight. 2019 was the second hottest year in history, the growing inestability in the middle east and even the possible AI use in warfare don’t help to move this time backwards. The picture is not a pretty one but there is at least one more voice reminding world leaders what is at stake here.
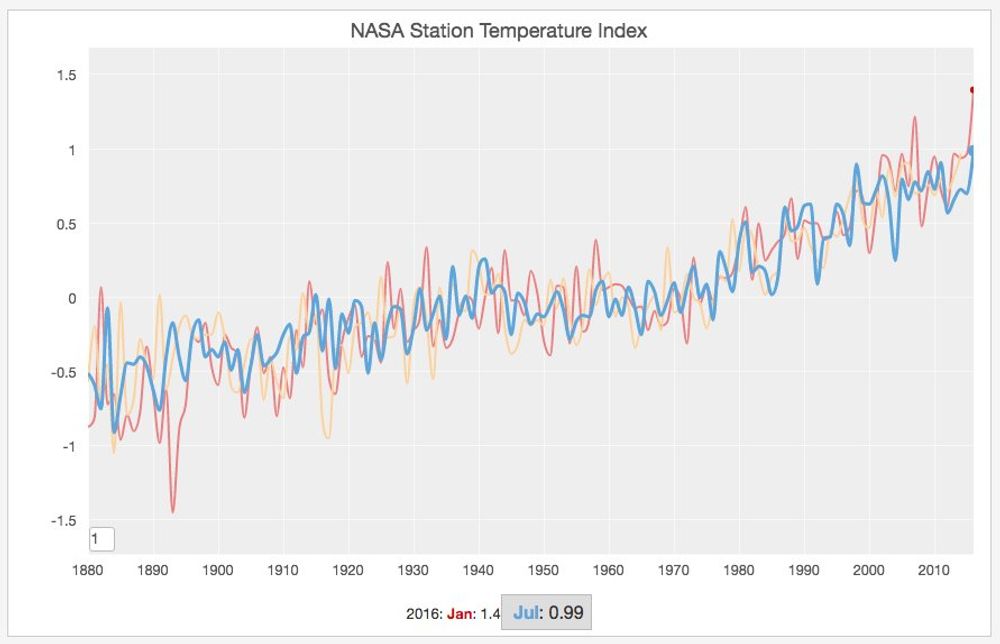
The hotest June and July ever recorded
Sep 18, 2019
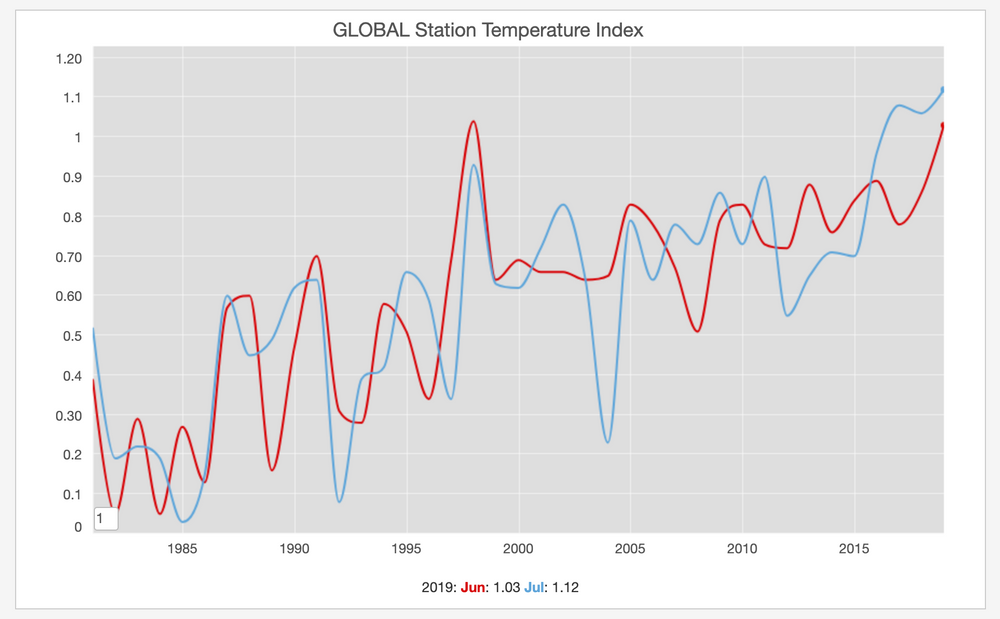
Last summer felt really hot! There were quite a few days when most of the headlines in the news were about how the thermometer was about to break historic records in many cities. It is no surprising therefore that the earth temperature change measured by NASA during the months of June and July was the highest ever recorded.
The "breaking record" headlines are following the same pattern year after year. I don't remember anytime in my lifetime when the global warming was such a clear and present danger!.
Tropical Storms per year in the atlantic
Sep 06, 2017
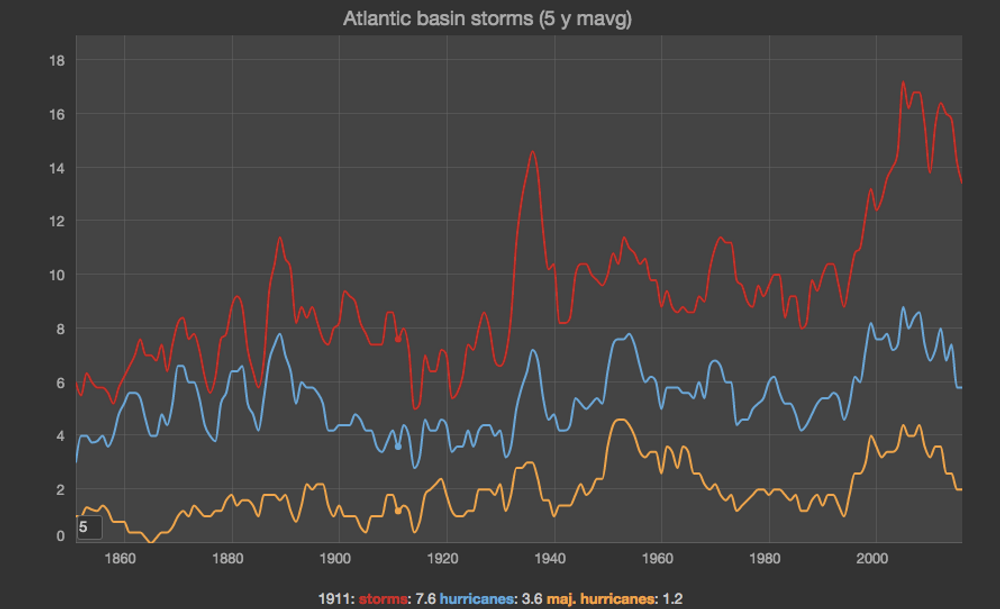
In a couple of week we have in the news stories about Harvey and now Irma. Harvey caused a lot of havoc in Texas and now Irma seems to be on the same path in the caribbean islands and florida. The Hurricane Division of the Atlantic Oceanographic and Meteorological Laboratories track on their website the number of storms per year and based on the data it looks like the number is steadly increasing. sigh ... climate change.
2016 Hottest Year Ever
Jan 18, 2017
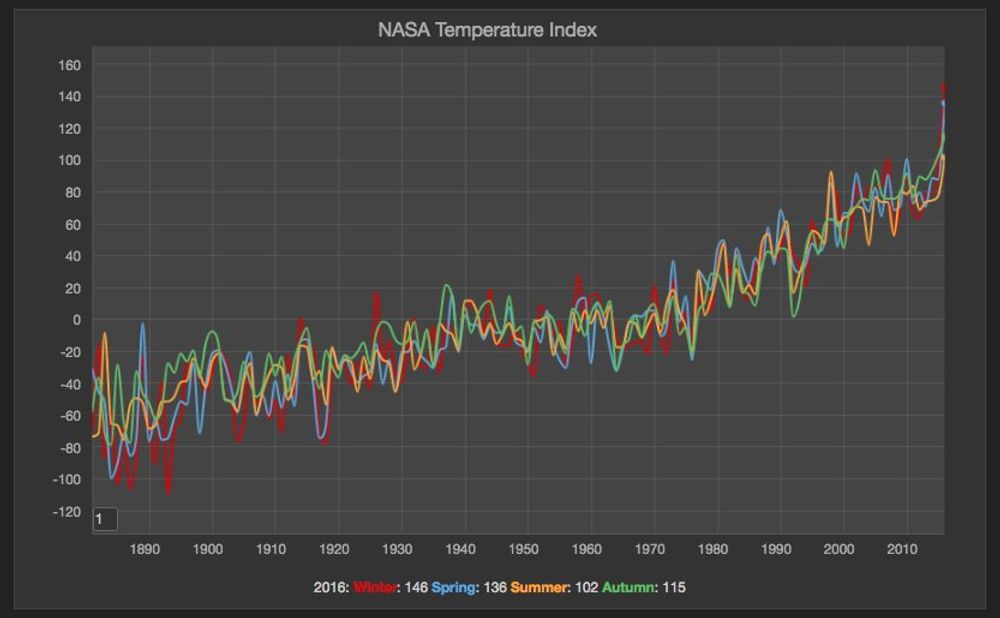
It's very unfortunate but not surprising that 2016 was the hottest year ever recorded. NASA revealed the consolidated reports and the data doesn't lie. Global warming is quite real. See the average by season chart.
CO2 Emissions per country
Jan 8, 2017
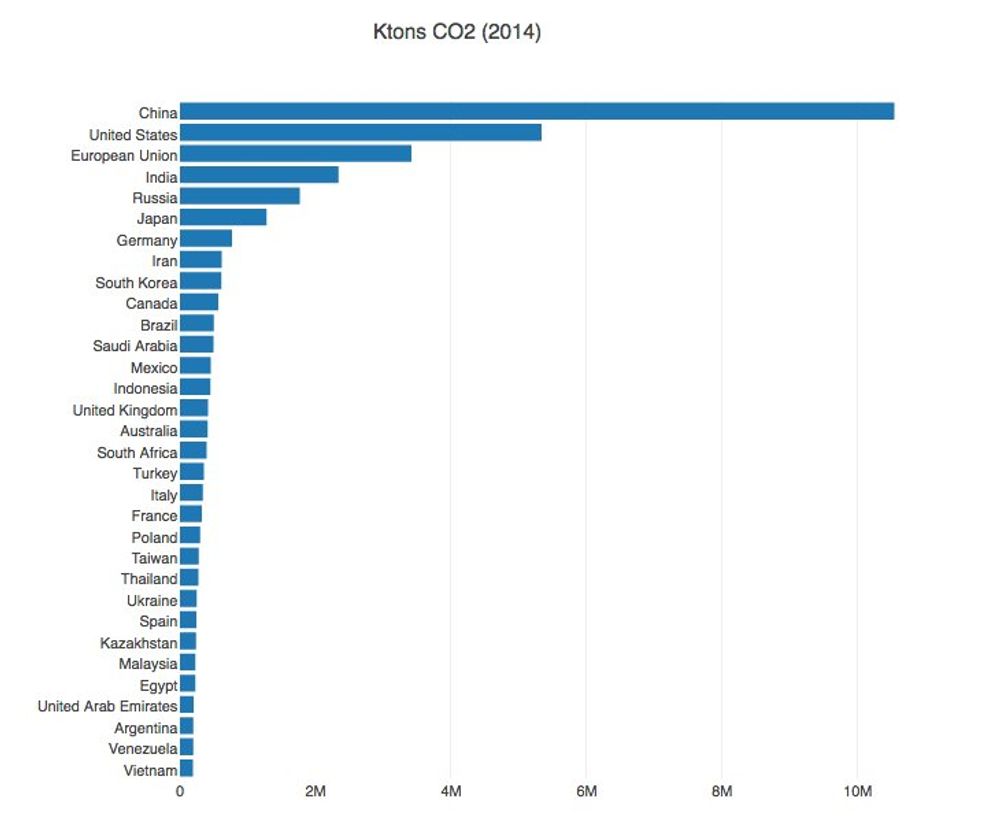
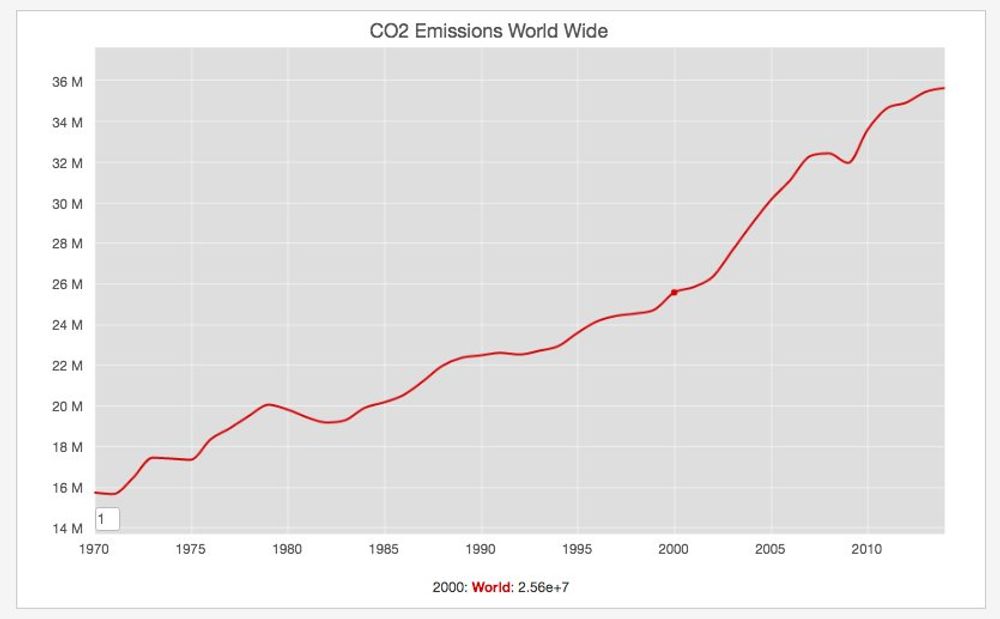
The European Union EDGAR database contains useful information about the CO2 emissions per country and worldwide. The previous graph shows the country with the highest CO2 Emissions (USA and China) and the total Emissions world wide. It's inside the spike the world experienced since 2000.
Global Warming Keeps Beating Records
Sep 1, 2016
According to an article published in the Guardian, the earth is warming at a pace unprecedented in 1,000 years. I discussed this point already three times in this blog, but I think it's worth to keep bring it up, because some people are not still convinced this is a real phenomenon.
Another Global Warming Record
Mar 14, 2016
Back in February I wrote on this blog how the world was really warming up and the data from February 2016 is even worst. The NASA reported that this month had the biggest temperature raise recorded in modern history:
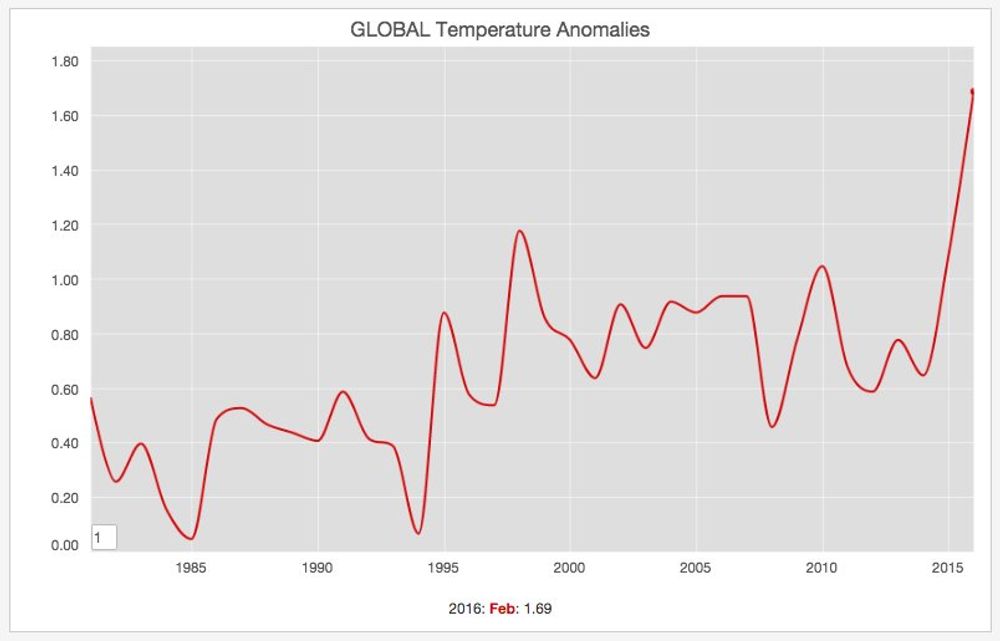
Again the world is warming up!
Worldwide Earthquake Statistics
Feb 15, 2016
Last Sunday I was reading the breaking news about a cliff that had collapsed into the sea on New Zealand’s South Island following a severe magnitude 5.9 earthquake that happened near to Christchurch. I remembered when I visited New Zealand last year that I heard the nickname of this country is the "Shaky Isles" for it's constant seismic activity. The two islands that compose this country lie on the margin of two colliding tectonic plates, making them earthquake prone.
The usgs.gov website has an interesting section with statistics about Earthquakes worldwide. Please find next a heatmap table with the data they publshed there :

There were two particularly deadly years: 2004 when a [tsunami hit many countries in the Indian Ocean](https://en.wikipedia.org/wiki/2004_Indian_Ocean_earthquake_and_tsunami), and 2010 when a huge earthquake happened in Léogâne, Haiti.
World Is Warming Up
Feb 9, 2016
Last sunday it was really warm here in Berlin. I was able to get on my bike and do a nice ride to the north part of the city. Nevertheless I remembered some data I read back in January about how the world is really warming up:
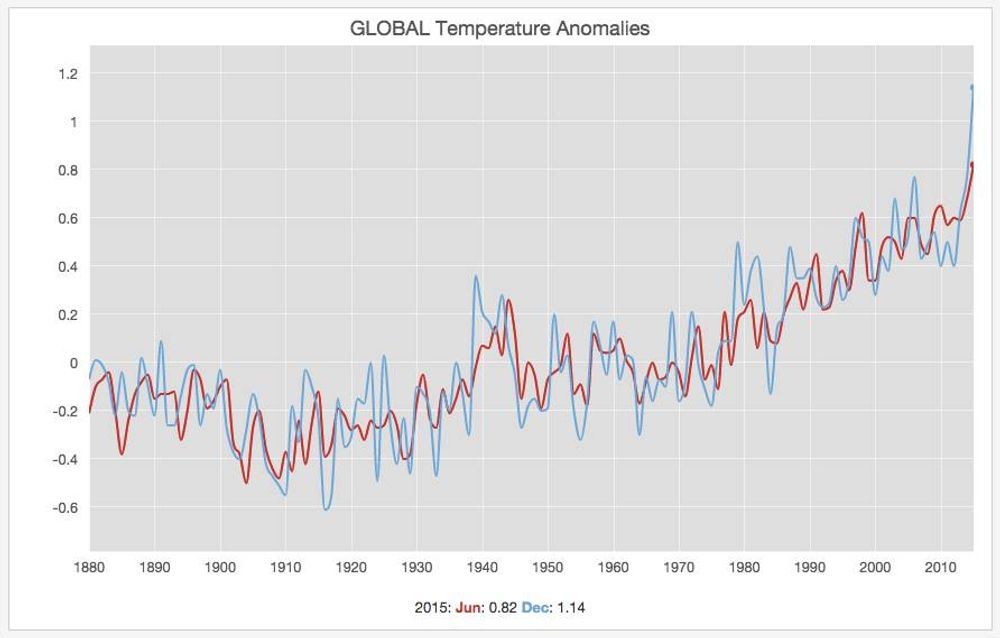
This winter has been really mild in Berlin.