Percentage of Europeans that do excersise
Mar 5, 2017
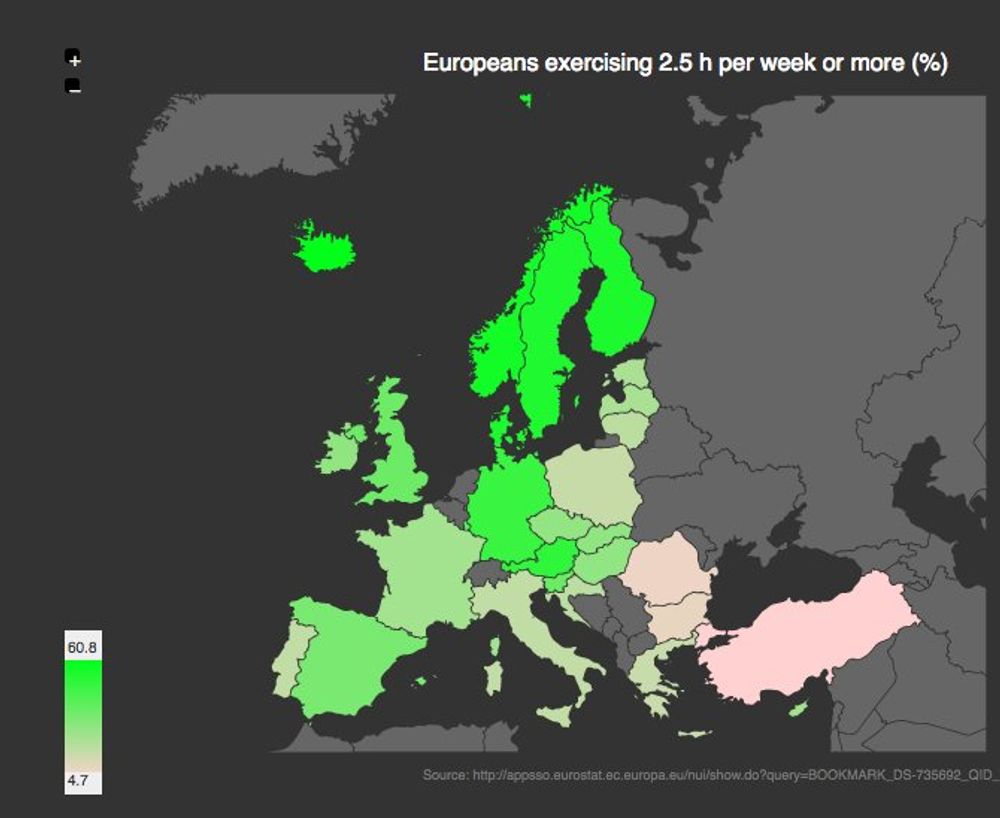
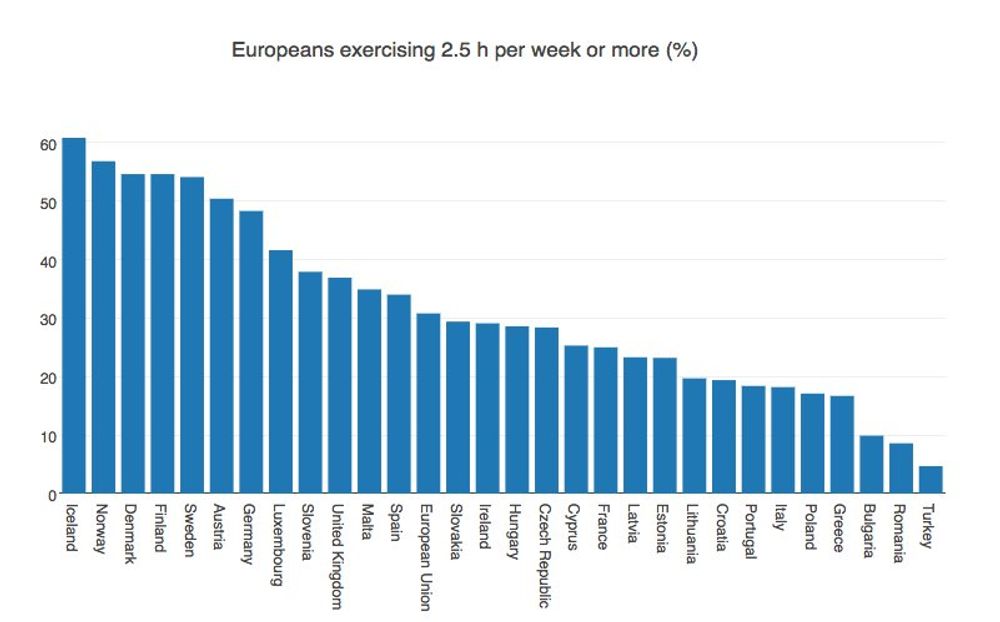
Eurostats has an interesting dataset with the time spent excersising per country in Europe. It's not surprising that on the top of the list of the countries that excersises 2.5h or more are the Scandinavian countries: Iceland, Norway, Denmark, Finland and Sweden are on the top of the list. Way to go Scandinavia!
Top 100 websites in the world by type
Feb 25, 2017
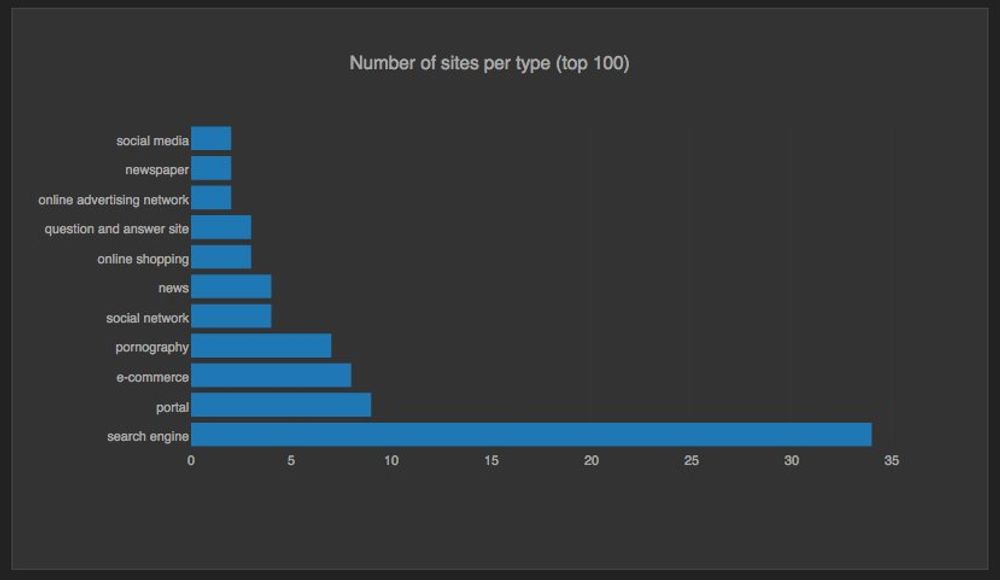
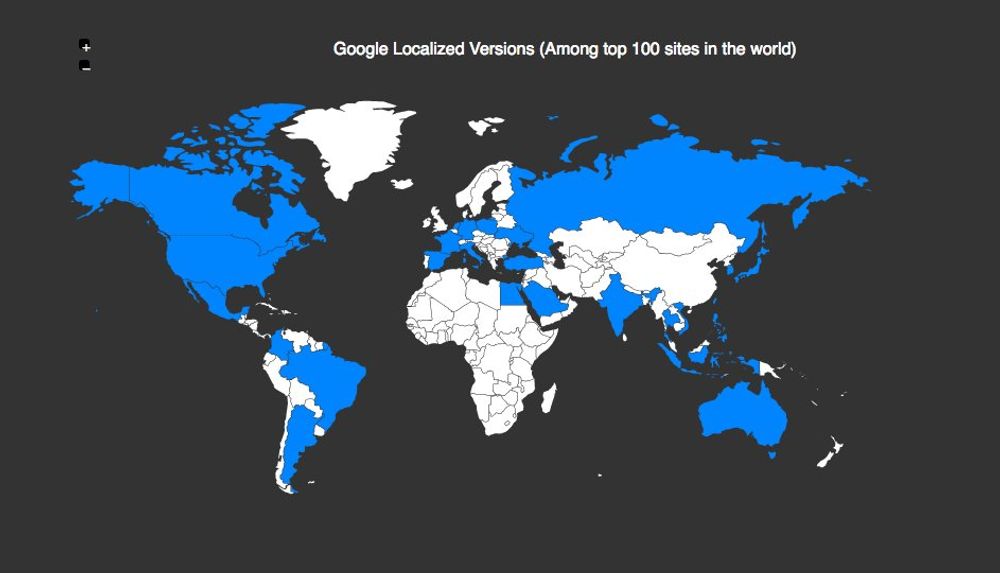
Wikipedia provides an article containing a list of the top 100 sites in the world in terms of traffic, using Alexa and SimilarWeb as sources. The chart above shows the type of sites count based on that list and Search Engines is the top category by far. Now, it's interesting to see how the main reason of this finding is due to the massive popularity of Google around the world: Its localized version on all this countries make it to the top 100 list:
USA Country of Immigrants
Feb 22, 2017
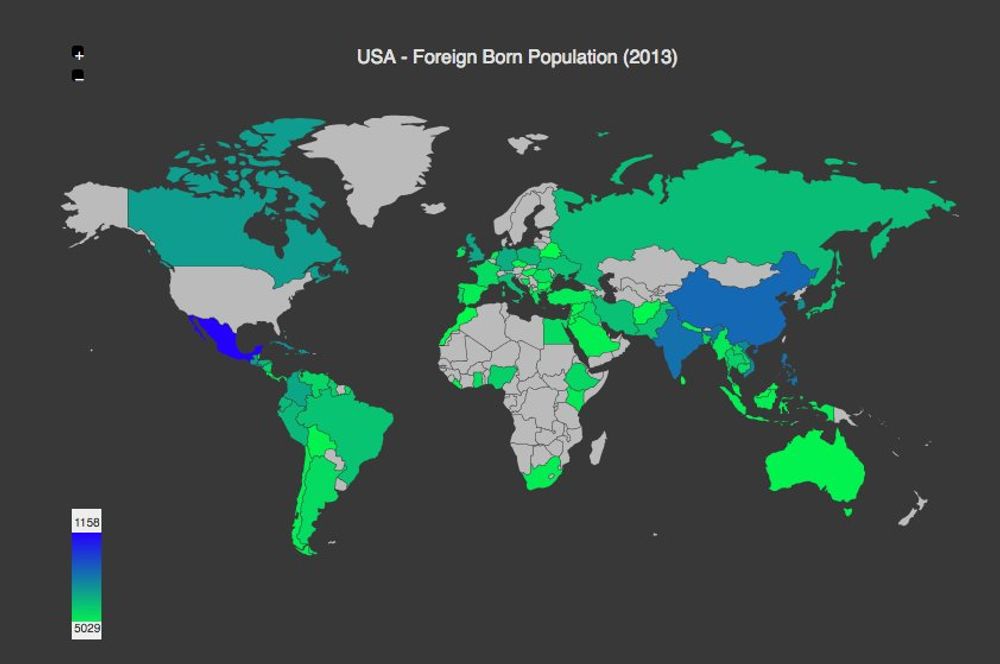
The USA is indeed a country of immigrants. In 2013, 41M people out of the total 316M population were foreign born, coming from all over the world. The top countries from that list are Mexico, China, India, Phillipines and Vietnam, but it's a true multinacional and multicultural society that should be embraced!
Top Flowers Exporters in the World
Feb 18, 2017
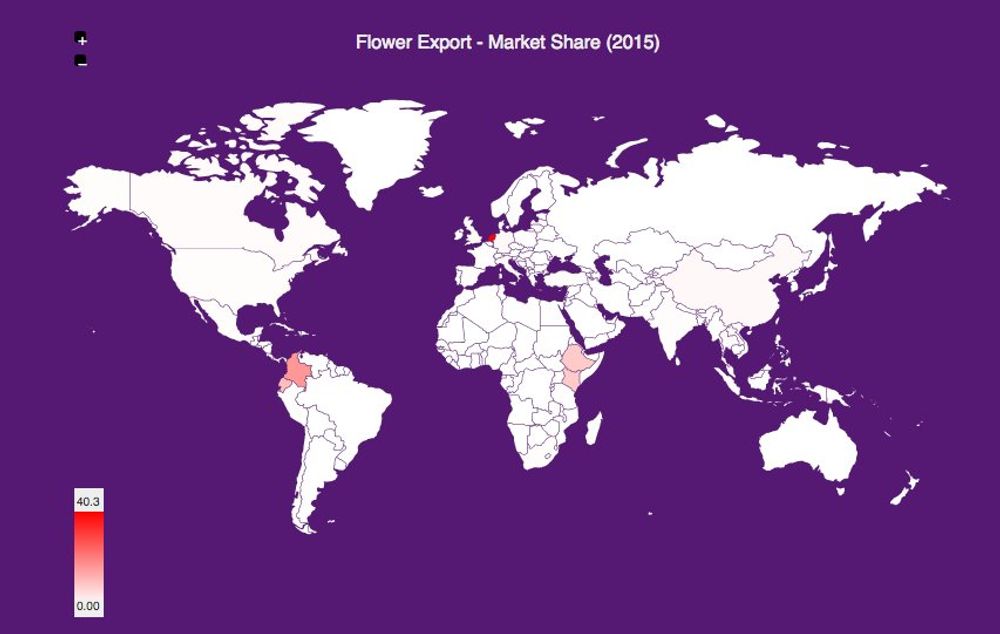
I knew Colombia was one the top flower exporters in the world, but a couple of days ago with all the flowers going around for St. Valentin's day I wondered who was the top exporter overall. Not surprinsing it's the Netherlands with a whooping ~40% market share of the world exports.
Next page