Rio Olympics Medals Table
Aug 8, 2016
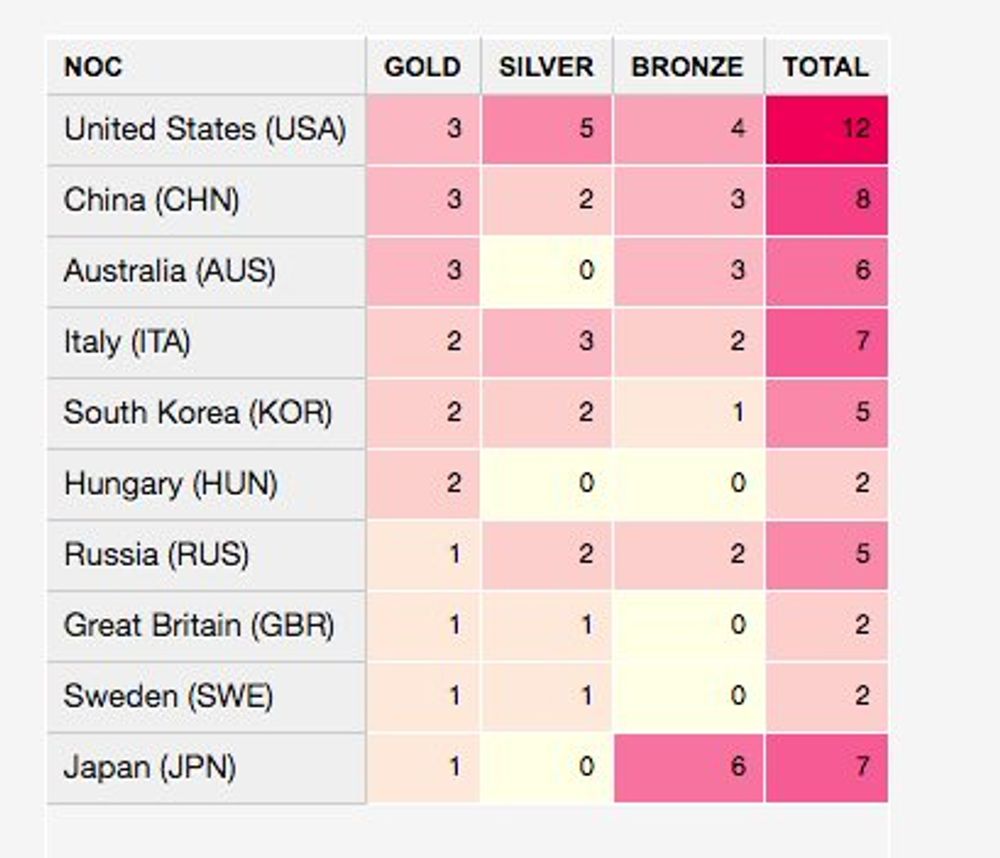
After a couple of days of competition in the 2016 Rio Summer Olympics, the medals table starts to look similar to London 2012. This is the current table
And this is how the table looked at the end of the London competition.
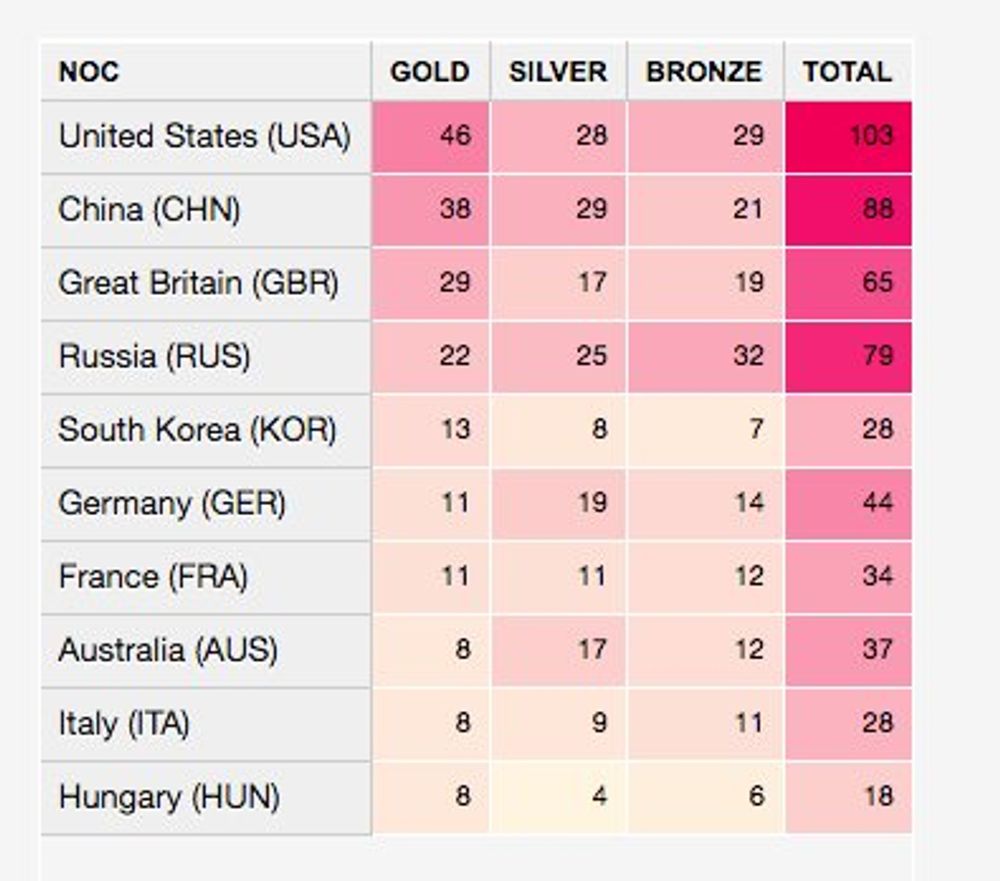
Clearly the US and China are dominating on this sport event.
Most And Less Common Blood Type
Mar 2, 2016
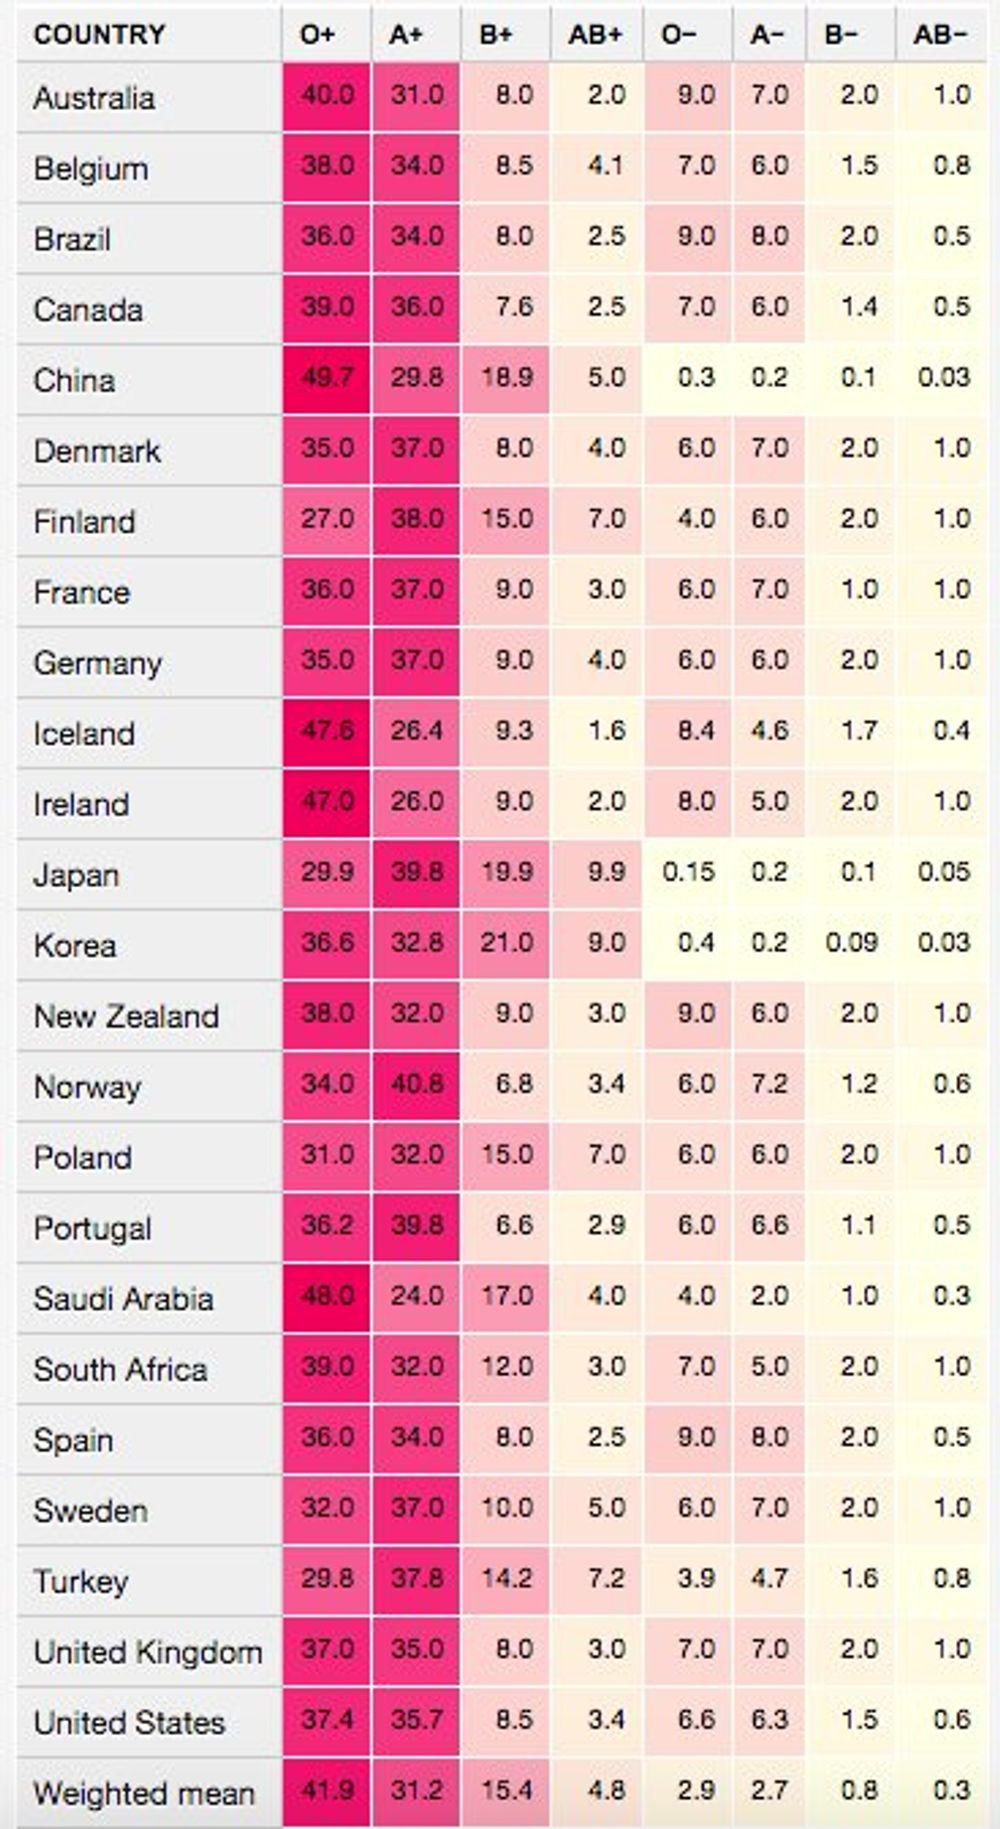
When I was at school I learned the blood type 0+ was the most common one and AB- the rarest one. Wikipedia has a good article about this information with a breakdown by country.
O+ and A+ are the most common ones and AB- is the least common:.
Inflation In Europe
Feb 29, 2016
Last Thursday the Eurostats Office published the inflation data for January 2016. Even if those numbers are definitively better than the hyperinflation happening in other regions of the world (cough ... Venezuela), there is always the risk on deflation:
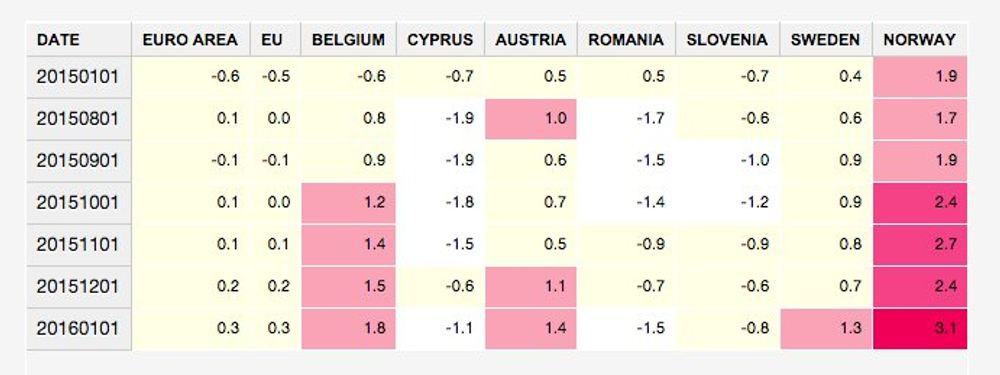
Now it's remarkable how the highest rate in Europe was Norway, a pretty expensive country already. I'm sorry for my Norwegian friends.
Most Active Programming Languages
Feb 10, 2016
It is hard to assess what are the most popular programming languages because there are multiple ways to measure them but none of the are perfect (ie. Repositories, lines of code, occurrences in job offers, etc). For example if work with embedded systems C is very popular, but if you work on the web the history is very different.
One interesting measurement of popularity of a language are the questions related to the language. Stack Overflow features questions and answers on a wide range of programming languages and compiles a list of the most popular tags with total, today and this week breakdown.

This data is a nice proxy on how popular are the different programming languages.

Us Unemployment Rate - 2016
Feb 8, 2016
The US Bureau of Labor Statistics published the unemployment figures for the month of January and the rate is low: 4.9%. It's one of the lowest unemployment rate since the whole financial crisis of 2008. The rate is half of what it was in the peak of October 2009:

Even if those are very good news for the American people, on the other hand the increase on the wages is still sluggish. In the last quarter of 2015 the rate was 1.9%. It was around 3% before the crisis hit hard.

If I were American I would ask those questions to the presidential candidates.
Foreign EU Citizens In Berlin By District
Feb 4, 2016
I wanted to wrap up this series of post I have been writing about the people living in Berlin, using data provided by the Statistical Office of Berlin-Brandenburg, with a final post about EU foreign citizens living in the city.
A couple of days ago I was discussing how Poland, Italy and Bulgaria where the EU countries with the highest number of expats living in the Berlin, but the data also contains a very interesting breakdown per district (berzik).
I put the totals in a density map:

I also used the specific countries data to create a matrix heatmap using an the tutorial on how to create a heatmap with jQuery and Tables. See the resulting table below:

There a couple of interesting conclussions from the data: Polish are definitively the highest minority from the EU countries and this can be observed in every district. Mitte is definitively the most popular district for most of the EU citizens and finally Marzahn-Hellersdorf is the least popular overall.